

LCP Diagnostics
Identify the exact elements dragging down your Largest Contentful Paint metric.
Run a fast, comprehensive page speed audit to uncover slow pages, prioritize fixes, and improve Core Web Vitals for better SEO and UX.
Analyzing… this usually takes 10–30 seconds.
Join thousands of developers and marketers optimizing their page load speeds.
Stop losing rankings and customers due to slow-loading pages. PageSpeed Pro instantly analyzes your site to identify render-blocking resources, large payloads, and scripting bottlenecks.
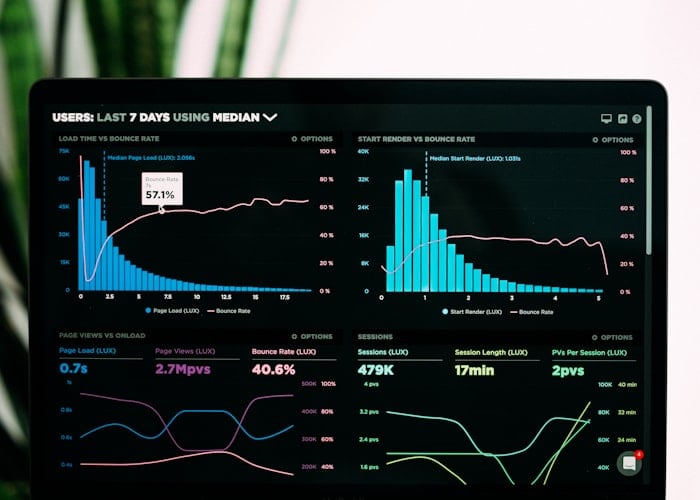
Everything you need to debug, optimize, and accelerate your site.
Identify the exact elements dragging down your Largest Contentful Paint metric.
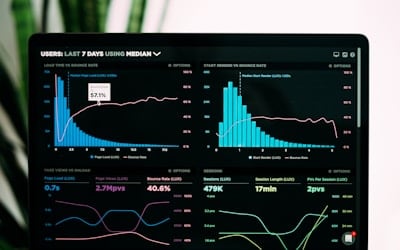
Measure and break down your page weight by scripts, stylesheets, and media.

Find long-running tasks and scripts that block main thread responsiveness.

Track exactly which DOM elements are shifting during page load.

Measure TTFB and discover backend delays holding your frontend back.

Highlight oversized images and formats that need next-gen conversion.

Compare your load times against your top competitors in real-time.

Download comprehensive technical CSV reports for your engineering team.
Find exact performance bottlenecks without manual dev tools.
 1
1
Provide the page URL you want to test. Our engine fetches elements just like a real mobile or desktop browser.
 2
2
We analyze CSS payloads, script execution time, image optimization, TTFB, and layout shifts automatically.
 3
3
Receive a developer-ready report outlining exact scripts to defer, images to compress, and CSS to inline.
Actionable diagnostics that go beyond generic speed scores.
Stop guessing. Identify exact elements impacting Largest Contentful Paint, Interaction to Next Paint, and Cumulative Layout Shift.
Find long tasks blocking the main thread, excessive DOM depths, and overly complex CSS selectors that slow rendering algorithms.
Audits run via headless Chrome instance simulating proper viewport, user agents, and constrained network/CPU profiles.
Track your score over time and correlate drops in performance with your recent deployments or dependency upgrades.
Receive immediate alerts to webhooks or Slack when a new code release increases your load average beyond a threshold.
Receive clear "to-do" lists like "defer script X", "compress image Y", and "inline CSS block Z" rather than vague metrics.
Performance matters for conversions, rankings, and user retention.
Pinpoint exactly which React component, unoptimized image bundle, or third-party ad script is locking up the browser thread.
Every second delay costs conversion. Optimize heavy category pages, product galleries, and checkout flows to ensure seamless buying.
Core Web Vitals are a direct ranking factor. Ensure technical hurdles aren't preventing your high-quality content from ranking #1.
Understand how infrastructure response times (TTFB) and CDN cache hit rates influence end-user experienced load speeds globally.
How developers are saving milliseconds with PageSpeed Pro
PageSpeed Pro showed us exactly which third-party scripts were blocking our main thread. We deferred them and dropped our LCP from 4.2s to 1.8s.

The payload analysis is incredible. We discovered our images weren't properly compressed in next-gen formats. Converting them saved us 2MB per page load.

We use PageSpeed Pro for all our client audits. The granular breakdown of layout shifts (CLS) makes it trivial to stabilize the UI.

The visual stability tracking warned us about ad injection shifts. We defined container sizes and eliminated our CLS penalty instantly.

TTFB insights revealed our database queries were holding back our initial response. A quick caching layer fix drastically improved load times.

Seeing how we compare to competitors' load times pushed our team. We now ship smaller bundles and consistently out-load our top 3 rivals.

Understanding Page Speed & Core Web Vitals
Start your free Page Speed analysis now and eliminate those long load times.
Get Started Free