
Is it happening with you, too? You’re creating content every day, posting, editing, publishing, but the growth just isn’t showing up?
That might be because your audience is looking for something else.
Most creators focus so much on producing content that they skip the most powerful step: learning from it.
How to Use Analytics From Generated Content is something many creators ignore, even though it can completely change their strategy.
And how can you learn from it? Well, through your analytics. It holds the answers to questions like what’s working, what’s not, and what your audience actually wants more of.
Continue reading to find out more about this.
Understanding Analytics From Generated Content
First, let’s understand what we mean by “analytics from generated content.”
When we talk about How to Use Analytics From Generated Content, we mean looking at the content you’ve already produced. It can be created manually or with AI-assisted or automated tools. Then you measure how it performs with your audience.
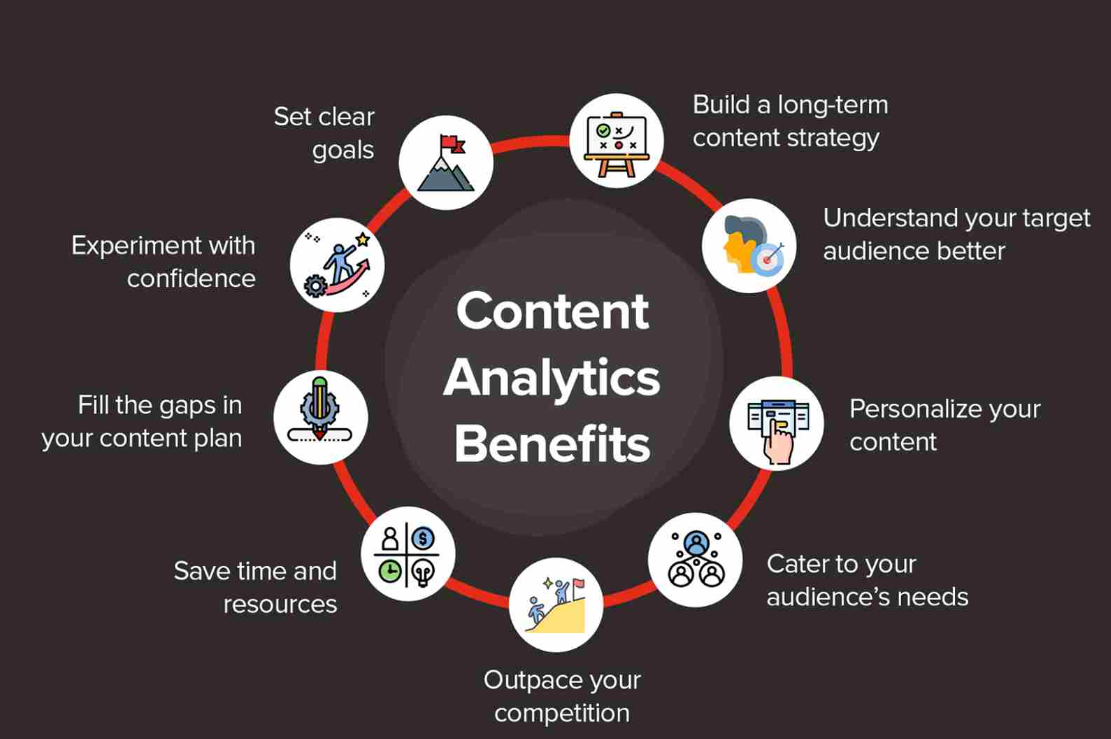
In other words, content analytics is the process of measuring and analyzing how users interact and engage with digital content.
Here are key metric categories:
- Engagement metrics: Likes, shares, comments, scroll depth, and reading time. These tell you whether people interacted with your content.
- Conversion metrics: Clicks, sign-ups, and purchases. They tell you whether your content caused a desired action.
- Retention metrics: Return visitors, how long people stayed, and how many pages they viewed. Through these metrics, you understand whether your content created sustained interest.
Why this matters? Knowing what your audience actually reacts to gives you power. You move from “I hope this works” to “I know this works or doesn’t.”
That means you can create better, more intentional posts. The posts created using analytics are aligned to what your audience wants, rather than what you think they want.
For example, if you generate a weekly blog post with an AI-assistant and also share it on LinkedIn and Twitter, you might find that Twitter drives a lot of shares but low reading time. And LinkedIn drives fewer shares but deep reading and more click-throughs.
That tells you different things, and your next post can be tailored differently.
How to Find and Read the Right Data
So you’re convinced that analytics matter. But how do you actually gather and interpret it? Here’s the step-by-step process.
How to gather the data
- Use the built-in analytics on your publishing platforms. Your blog’s CMS, e.g., WordPress, or social networks like Twitter Analytics, LinkedIn Analytics, or YouTube Studio for videos, etc., give you baseline numbers. This is the first step in understanding How to Use Analytics From Generated Content effectively.
- Use AI content tools or automated content tools like fibbler.co that include performance dashboards. Many modern tools now integrate analytics dashboards so you can see the performance of AI-generated content alongside regular content.
One such tool, Surfer, uses AI to track brand visibility. This helps you determine whether your content strategy is actually working. It shows rankings and reveals what kind of content makes your brand visible in the crowded digital space.
Similarly, SocialBee offers a social media analytics dashboard where you can easily track and measure your performance across platforms.
What to look for
Now that you have the data, here are some questions that you should ask:
- Which headlines drive engagement? Look at posts with the highest engagement metrics. What headline did you use? What tone? What promise?
- What tone of voice or length performs better? Maybe shorter posts or conversational tone get more shares; maybe longer, deeper posts get more reading time.
- When are your followers most active? Look at publishing time and audience activity. If you publish at 9 am EST but your audience is online at 7 pm, you might shift your schedule.
You’ll notice patterns. Maybe your readers engage more with storytelling posts on Friday evenings or prefer carousel posts over plain text updates. Once you see these behaviors, you’re no longer posting blindly; you’re responding to real signals.
Also, segment your data if possible. Look by content type, whether it’s blog vs video, by topic, by author (if you’re a multi-writer team), or by channel. The more granular you go, the more fine-tuned your next move becomes.
Content analytics platforms highlight trends such as “readers who stay beyond 3 minutes are 40% more likely to download a whitepaper.”
Finally, don’t ignore the low-performing posts. They hide insight, too. A post that under-performs might tell you a topic your audience doesn’t care about (or you approached wrong), or an asset (image/format/length) that doesn’t engage.
Revisiting low performers is as important as celebrating big winners.
Turning Analytics Into Your Next Content Ideas
Turn signals from your analytics into a repeatable content playbook: Identify → Adapt → Increase Frequency.
Analytics is your creative brainstorming partner. Every chart or graph tells a story about what to double down on, what to experiment with, and what to leave behind. To visualize and organize these insights effectively, you can use an AI roadmap generator to map your future content ideas and goals in a structured way.
Just like AI is transforming corporate learning by helping professionals adapt faster through data-backed feedback, creators can evolve their content strategies using measurable insights.
Step 1: Double Down on What Works
If your audience loves your “quick tips” videos, create a series out of them. If your “behind-the-scenes” post performed 2x better than your announcements, make them your regular feature. This is exactly where How to Use Analytics From Generated Content becomes practical and powerful.
Data tells you what your audience values, and your job is to give them more of it.
Step 2: Repackage High-Performing Content
Don’t reinvent every wheel.
Turn your best blog into a short LinkedIn post. Convert a popular YouTube segment into a carousel or newsletter story. A single well-performing piece can live many lives across platforms.
Step 3: Fix or Test Underperforming Posts
When something doesn’t work, don’t scrap it, study it.
Did a headline lack curiosity? Was the visual too busy? Was the post published at the wrong time?
Small tweaks like rewording a headline or changing a thumbnail can drastically improve results.
Why is this a big deal?
Because now you stop guessing. You’re improving based on real audience behavior. That means you’re saving time, energy, and increasing your chance of success.
Instead of “let’s try what we think might work,” you’re saying “let’s build on what we know works and test what we’re uncertain about.”
Here’s a simple example. You noticed that posts between 800 to 1,000 words about productivity get 30% more reading time than posts with 1,500 words. So, you plan your next five posts at a shorter length. Then you track again. Over time, you refine.
Another example is that you discover that your audience loves posts about AI tools for content creators, and those posts convert readers into your email list at 5% rather than your usual 2%.
That tells you that you should create more content in that niche, and perhaps build an email series or lead magnet around it.
Real Example: Building Brand Identity With Data Insights
Data tells you who your brand is becoming. When you read your analytics closely, patterns emerge: what kind of tone your audience responds to, which visuals they love, and what storytelling rhythm keeps them coming back.
UMAI Clothing, an anime-inspired streetwear brand, grew from a small creator project into a business with six-figure monthly sales. The founders used analytics and on-demand fulfillment through Printful to refine their products and brand identity.
The Challenge
UMAI wanted to release bold and creative apparel without the slow turnaround or high inventory risk of traditional manufacturing. They also needed real data about which designs and visuals resonated most with fans.
The Solution
Using Printful’s fulfillment analytics and customer engagement data, UMAI began testing new designs in smaller batches. They tracked what customers clicked, saved, and purchased most, and combined that insight with website metrics such as conversion rates and cart value.
This helped them discover their strongest patterns: buyers preferred hand-drawn artwork and minimalist color palettes.
Brands are increasingly turning to customized clothing to strengthen their identity and connect with their audience. Platforms like Printful make it easy to design and ship products that reflect your brand’s personality.
When combined with analytics from generated content, this approach helps businesses understand what their audience values and express it consistently.
The Results
UMAI Clothing became a fast-scaling brand by using data-driven analytics. They ran Facebook ads based on market analysis. Within two months, they saw 15% to 20% growth, eventually leaping from $20K in monthly sales to around $100K.
More importantly, it gave them a unified brand voice from the art printed on hoodies to the captions beneath their Instagram posts.
Just like data guides product design, it can guide content strategy.
Both rely on understanding your audience deeply and delivering something that resonates.
When you know what people love, you can create more of it, refine it, and keep evolving confidently.
How AI Tools Simplify the Process
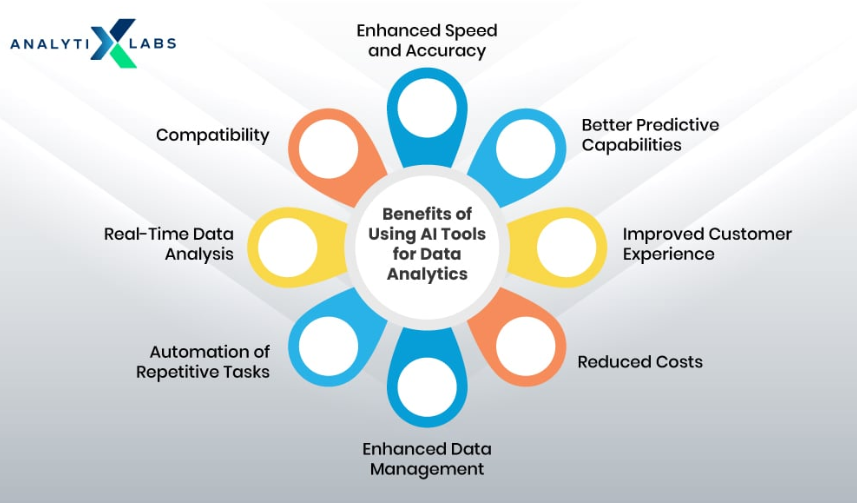
Now let’s talk efficiency. Analytics is great, but manually digging through numbers can be tedious. That’s where AI-powered writing and analytics tools come in.
These tools can:
- Automatically analyze the engagement of your content. They pull data like reading times, social shares, bounce rates, and topic clusters.
- Suggest topics, tones, and keywords that match what your audience is interested in. That way, you don’t just rely on your instincts; you get signals from data.
- Help you test what’s working faster. For example, they might suggest you try a blog post of X length on topic Y, with tone Z, because past content with those attributes outperformed others.
Why this matters: It saves time while ensuring every new post has a higher chance of performing better than the last. It builds a smart loop where you generate, publish, learn, and improve, and the tool helps at each step.
Traditionally, you produced a post, waited for metrics, and then manually reviewed. With AI-assisted analytics, you shorten the loop. You check performance almost in real-time, detect signals, and then you act.
For example, “this topic is gaining traction” or “the audience is dropping off after 2 minutes”. You test headlines, format, and visuals, all informed by data.
When you combine this with the analytics framework from earlier, you’re not just creating content, you’re building a content machine that learns with you.
Turn Insights Into a Content Habit
Analytics provides you with real-time feedback. It tells you what your audience sees, what they care about, and how they behave. And when you build a habit around reviewing and acting on those insights, your content strategy becomes far more purposeful.
Here’s a practical weekly habit you can adopt:
- Review content data weekly. Check your top posts, your bottom posts, and trends in engagement, conversions, and retention. A tool like StoryChief’s Content Audit Tool can make this much easier.
- Adjust tone, topics, or formats based on results. For example, if Tuesdays bring higher engagement, schedule more posts then. If short posts outperform long, adjust.
- Keep experimenting. Use the insights to double down on what works, but also test new formats so you don’t get stuck.
- Let data guide creativity, not limit it. Use the data to inspire, not to box you in. Because your aim is still to be creative, curious, and original.
And if you want to make that process faster and easier, AI-powered platforms like Writecream can help you.
Want to see how it works for your brand? Click here to get started for free.
