

Virtual Event Analytics Dashboards
Monitor registrations, attendance, engagement, session quality, and sponsorship impact in one place.
Integrate virtual event platforms, streaming tools, CRMs, and marketing automation. Get live insights, automated alerts, performance tracking, and executive-ready reporting—everything teams need to elevate attendee experience and maximize event ROI.
HQ: Slow generation with high quality

Real-Time Attendance Monitoring
Unified registration, check-in, and live attendance metrics across all virtual event platforms. Track participant join times, session duration, and device types to ensure seamless access. Automatically reconcile registration lists with actual attendees and identify no-shows instantly for follow-up campaigns.

Engagement Signals & Outcomes
Audience engagement, Q&A and poll activity, session stickiness, and pipeline influence across tracks. Measure active participation through chat volume, emoji reactions, and downloadable content interactions. Correlate engagement spikes with specific speakers or topics to optimize future content strategy.

Experience Risks & Opportunities
Drop-off alerts, stream quality issues, low-engagement sessions, and sponsor fulfillment tracking. Detect buffering events or audio issues in real-time to minimize attendee churn. Identify high-potential leads based on session behavior and automatically route them to sales teams for immediate outreach.
How It Works
Launch event analytics dashboards and start tracking attendee experience in three simple steps

Connect Event Platforms & Data Sources
Integrate webinar, virtual event, CRM, marketing automation, and streaming tools in minutes. Connect data from Zoom, Hopin, Cvent, HubSpot, and Google Analytics to create a single source of truth for event performance.

Define Event KPIs & Automated Alerts
Set attendance SLAs, engagement targets, NPS thresholds, and automated alerts to ops and marketing teams. Configure real-time notifications for registration dips, stream buffering, or speaker technical issues.

Deploy Dashboards & Stakeholder Reports
Share live event performance views, automate sponsor reports, and keep stakeholders aligned in real time. Generate post-event ROI analysis, attendee journey maps, and executive summaries with a single click.
Popular Event Analytics Use Cases
Dashboards for every virtual event, webinar, and sponsorship metric—track attendance, engagement, and revenue in real time.

Registration & Attendance
Sign-up velocity, check-in rates, live attendance by session, and no-show analysis. Track conversion from landing page to event lobby, identifying drop-off points in the funnel.

Engagement & Interaction
Poll responses, Q&A depth, chat activity, emoji reactions, and content resonance by track. Measure how active your audience is during keynotes versus breakouts.

Stream Quality & Support
Buffering incidents, stream health, device mix, and support ticket hotspots during live sessions. Proactively identify technical issues before they impact the broader audience.

Sponsor ROI & Leads
Lead capture by booth, meeting bookings, sponsored session performance, and revenue attribution. Prove value to partners with detailed engagement reports.
Quick Templates for Event Insights
See It In Action
Real-time event intelligence generated from simple natural language prompts
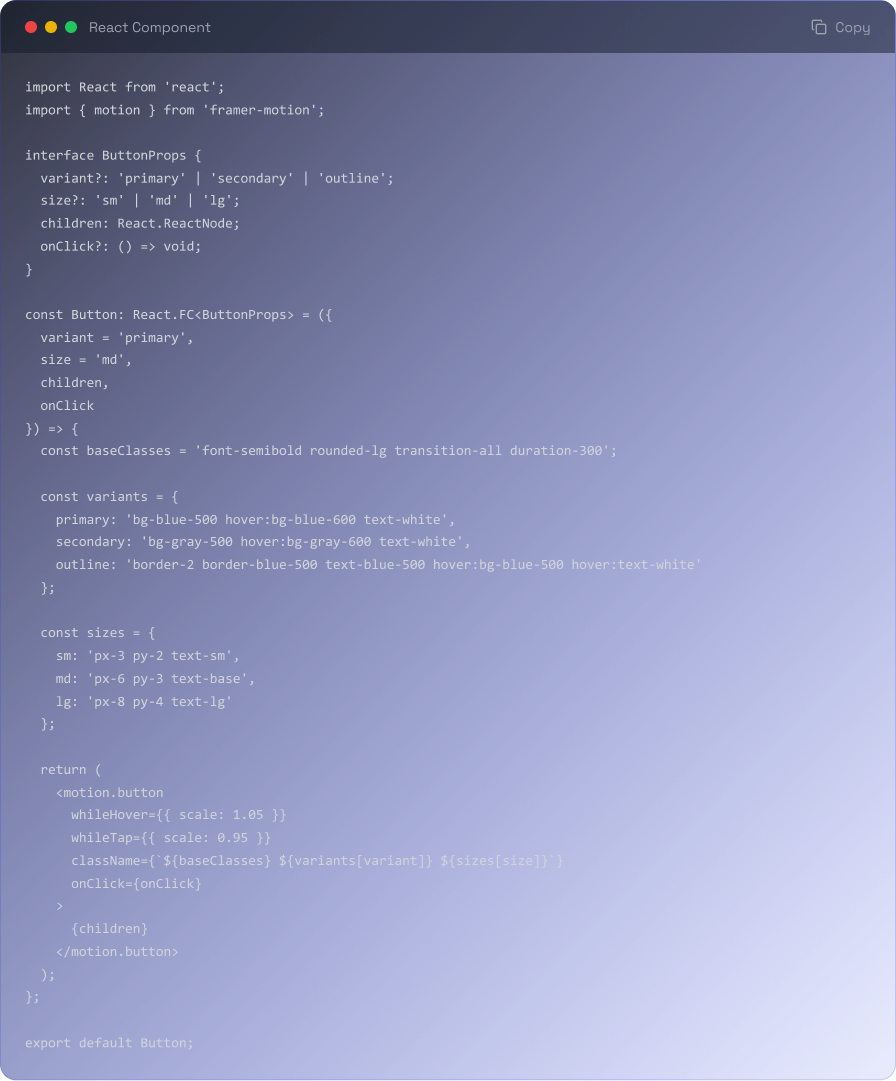

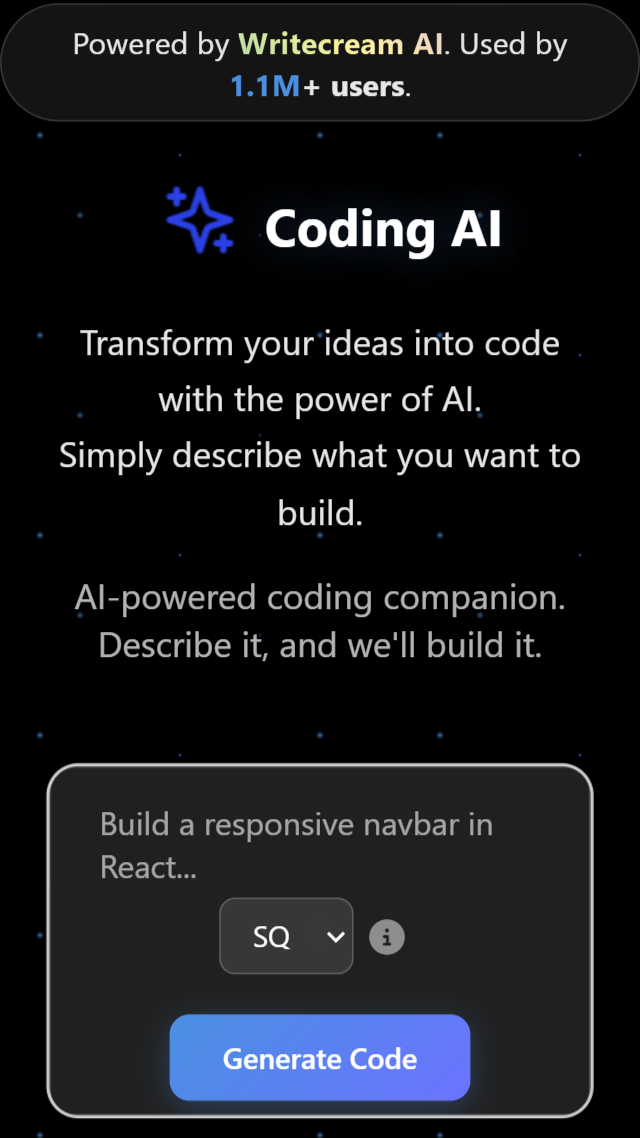
Virtual Event Intelligence made simple and powerful
From check-in to checkout, specific tools for every stage of your event lifecycle.

Sentiment & Feedback
Interactive net promoter score (NPS) tracking and session rating heatmaps.

Speaker Performance
Audience retention rates and engagement scores by individual speaker.

Predictive Attendance
Forecast live turnout based on registration and marketing touchpoints.

Live API Connectors
Sync with Hubspot, Salesforce, and Marketo for instant lead routing.
Check-in Alerts
Push notifications for VIP arrivals or high-value prospect attendance.

Automated Debriefs
Scheduled post-event executive summaries and sponsor ROI PDFs.
Trusted by Event Teams
Event ops, marketing, revenue, and customer teams running high-impact virtual experiences at scale

"EventPulse helped us recover 20% of our attendees who were experiencing stream issues in real-time. The ROI dashboard also proved our sponsorship value instantly."
Ready to optimize your events?
Get the data you need to drive engagement and revenue for every session.
Trusted by event organizers worldwide