
When was the last time you used Facebook? An hour ago? A minute ago? Or a second ago? The answer to that question proves how Facebook has become an inherent part of our lives. Especially for youngsters like us, it is more of a reflex to open Facebook as soon as we get some free time.
Being one of the oldest social media sites, Facebook has left a strong imprint in the minds of today’s generation, young and elders alike. In 2022, it would be absurd to ask someone whether they use Facebook or not. This endless popularity is drawing businesses like yours to make room for themselves to gain customers. However, that calls for a lot of research and digging into every element of Facebook that might concern your business. That’s where stats come in. For common users, Facebook is just about sharing pictures and stories. However, businesses need to overview a lot of factors and elements that are crucial to effectively utilize the glamour of a popular site like Facebook.
And that’s what I am here for. For seasoned business owners, Facebook is a sea of opportunities; however, new businesses and individuals must have a strong grasp of certain statistical data, which helps them discover the array of hidden opportunities to get the most from such an extraordinary network.
Keeping that in mind, I have compiled together numerous Facebook statistics of different categories that one must not fail to understand. Keep reading!
FACEBOOK USER STATISTICS
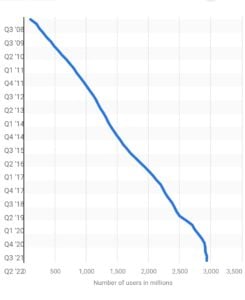
- Over the last few years, Facebook has witnessed quite a surge in its monthly active users base. There are a billion monthly active users. Moreover, the bygone pandemic has acted like fuel to the flame, with the number of active users skyrocketing from 2,603 million in the first quarter of 2020 to 2,701 million in the second quarter and subsequently 2,797 million in the fourth quarter. And don’t you think these numbers have fallen once the pandemic was at bay as the numbers have continued to rise. Speaking of now, Facebook has more than 2,934 million users in the second quarter of 2022. (Source:Statista).
- Those demographics above were worldwide figures. Now let’s take a look at the countries which have the most number of active users. For starters, India tops the list of active users with 329.65 million users. Next in line is the United States, with 179.65 million users, and Indonesia, with 129.85 million users. The other countries which constitute the majority of active users are Brazil, Mexico, the Philippines, and Vietnam. (Source: Statista)
- Well, aren’t we forgetting something? We know how many facebook users and from where but do we know how they are using it? There are a bunch of devices one can use to log into their Facebook account. From Computers and Laptops to tablets and mobile phones, it is extremely convenient for everyone to access their accounts from any device. However, as far as the statistics are concerned, 98.5% of its active users access their accounts through a mobile phone, while only 1.5% from a Laptop or Desktop. Among those, 16.7% of the users access their accounts both using a mobile phone or PC. (Source: Statista)
- Speaking of daily active users, it is not surprising that in the second quarter of 2022, there were about 1,968 million daily active users, and that’s not far from the first quarter, which reported 1,960 million active users. That’s quite a bit of a surge compared to the first quarter of 2021, which reported 1,878 million active users. (Source: Statista)
- In 2022, people between the age group of 25-34 account for the most percentage of Facebook users, with men comprising 18.4% while women 12.6%. That being followed by individuals belonging to the age of 18-24%, with 9.3% females and 13.3% males.
FACEBOOK GENERAL STATISTICS
Let’s take a look at some demographics about Facebook in general.
- According to Statista, 94% of global marketers use Facebook for their marketing activities.
- Speaking of famous personalities, Cristiano Ronaldo is the most followed person on Facebook, with over 122 million fans as of June 2022. The other fan pages with the highest followers are that of Facebook, with over 214 million followers, and Samsung, with over 159 million followers. (Source: Statista)
- Facebook’s total revenue in the year 2021 was 117,929 million US dollars. The same being 85,965 million dollars in the year 2020.
- Speaking of engagement, Statista reports say that Status Posts, people use Facebook to draw the maximum amount of engagement, having an engagement rate of 0.13%. In contrast, link posts had the lowest engagement rate.
- According to Statista, as of January 2021, the average time spent on Facebook by an American in a day was 33 minutes. It also claims that Facebook was the social media platform where they spent the most of their time each day.
FACEBOOK ADVERTISING STATISTICS
Ads are an important component of every social networking site. They are considered as the principal source of revenue for every social media platform, through average facebook posts as well as facebook stories. The huge volume of active users and its popularity is the reason why businesses find it the most suitable platform for their digital advertising campaigns. That being said, take a look at some info about Facebook ads.
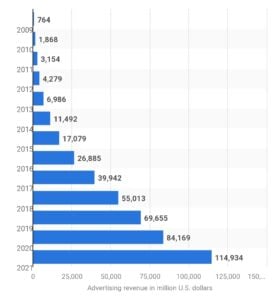
- Facebook witnessed a significant rise in its Ad revenue in the year 2021. As far as the data gathered by Statista is concerned, Facebook’s ad revenue in 2020 was 84,169 million dollars which rose to 114,934 million dollars in 2021.
- Speaking of the United States and Canada, Facebook’s total ad revenue was close to 13 billion US dollars. (Source: Statista)
- In recent years Facebook has become the most used platform for marketers to promote their businesses as well as products.
- Talking of the Cost Per Click(CPC) of Facebook ads, according to Wordstream, the average CPC of Facebook ads across all industries is $1.72, whereas clothing and apparel have the highest average CPC, which is $0.45.
- Compared to other social media platforms, Facebook app offers quite an impressive conversion rate, with the average conversion rate being 9.21% across all industries. Speaking industry-wise, the Education industry has the highest average conversion rate, which is 13.58%.
- According to Statista, Facebook had 7 million monthly active advertisers in the third quarter of 2019, which rose to 10 million in the third quarter of 2020.
FACEBOOK VIDEO STATISTICS
Videos, be they short or long, are dominating every social media network. Nowadays, users of every social media site find videos even more appealing than images. Anyways let’s take a look at some fascinating stats about Facebook videos.
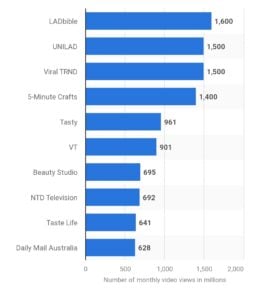
- According to Socialinsider, 15.51% of the total Facebook posts consist of Videos. The percentage has been increasing over the few years and is expected to rise further in the years to come.  Taking into account Statista’s report on the most watched Facebook video publishers worldwide as of March 2019, LADbible had the highest number of monthly views, which was 1,600 million. Following it were UNILAD and Viral TRND, with 1500 million views each.
- According to Socialinsider, 15.51% of the total Facebook posts consist of Videos. The percentage has been increasing over the few years and is expected to rise further in the years to come.
- Taking into account Statista’s report on the most watched Facebook video publishers worldwide as of March 2019, LADbible had the highest number of monthly views, which was 1,600 million. Following it were UNILAD and Viral TRND, with 1500 million views each.
- Let’s not forget about the engagement rate of those videos. As per Statista, in April 2020, Facebook accounts with followers ranging between 5000 and 10,000 had an engagement rate of 1.12% on live videos and 0.59% on pre-recorded videos. Also, those accounts with followers from 50k to 100k had an engagement rate of 0.42% on live videos and 0.44% on pre-recorded videos.
- Facebook claims that 1.25 billion users are attracted by the so-called ‘Facebook Watch’ every month. This allows them to watch their favorite videos, post their comments and share them with their friends.
FACEBOOK MARKETING STATISTICS
- As of November 2021, Facebook had the highest ROI(Return On Investment) compared to all the other social media platforms. According to the research conducted by Statista among B2B and B2C marketers, 21% of the respondents said that Facebook offered the highest ROI, followed by Instagram, with that of 18%.
- We have been quite familiar with Facebook Marketplace since its launch in 2016. As per Statista, in the first quarter of 2021, Facebook Marketplace had more than 1 billion monthly users on a global scale.
- Facebook shops have become a great platform for small businesses to attract more customers. As per reports by Statista, in the first quarter of 2021, there were an average of 1 million monthly active Facebook Shops and 250 million monthly visitors.
- Creating brand awareness is one of the most important goals of businesses using social sites like Facebook. That being said, in 2021, there were an average of 5.5 weekly brand posts across all categories. For instance, there were 53.5 posts per week by Media brands, w
Join Writecream for FREE!
In a few clicks and under 30 seconds, generate cold emails, blog articles, LinkedIn messages, YouTube videos, and more — no credit card required.
Start for FREE