
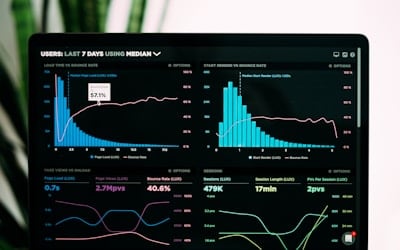
LCP Optimizer
Analyze your rendering path and identify the exact hero element slowing down your Largest Contentful Paint.
Analyze your page experience in minutes. Measure LCP, INP, and CLS, identify render-blocking resources, and fix speed bottlenecks to drive more organic traffic.
Analyzing… this usually takes 10–30 seconds.
Join thousands of developers and SEOs optimizing their page speed for better rankings.
Stop guessing why your site failed the Page Experience update. Our tool analyzes your site's performance bottlenecks to prevent slow load times and layout shifts from ruining your user experience.
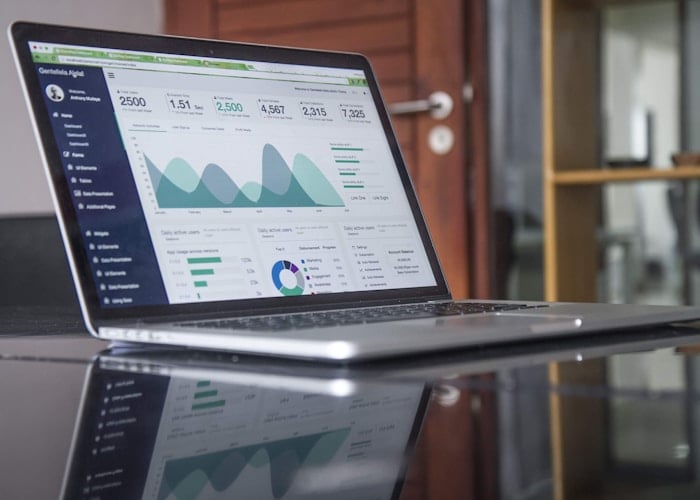
Everything you need to measure, debug, and optimize your page experience
Analyze your rendering path and identify the exact hero element slowing down your Largest Contentful Paint.

Find heavy JavaScript execution and long main-thread tasks that delay your Interaction to Next Paint.

Highlight elements that shift during page load to fix visual instability and improve Cumulative Layout Shift.

Extract real-world user experience data from the Chrome User Experience Report directly for your URLs.
Run simulated mobile and desktop performance tests in a controlled environment to benchmark improvements.

Visualize your asset loading sequence to spot third-party scripts blocking your main thread.

Test your page speed over simulated 3G and 4G connections to ensure performance for all users.

Export branded PDF reports outlining Core Web Vitals optimization opportunities for your clients.
The fast way to ensure your pages deliver a top-tier user experience
 1
1
Paste the webpage you want to test. Our system will initialize headless browsers to simulate user interactions and load patterns.
 2
2
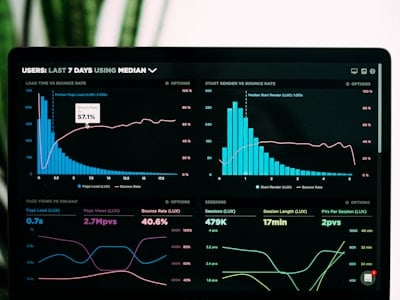
We compile data on LCP, INP, and CLS, combining simulated lab data with historical 28-day field data from Chrome users.
 3
3
Review the specific DOM elements causing issues, implement structural changes, and watch your Google Page Experience signals turn green.
The most comprehensive performance diagnostic tool for professional SEOs
We don't just give you a number. We analyze your critical request chain and network waterfalls.
Overlay your lab results with historical field data from actual Chrome users over the last 28 days.
Locate the exact DOM nodes causing Cumulative Layout Shifts or slowing down Largest Contentful Paint.
Simulate performance on low-end mobile devices and slow 4G networks to optimize for everyone.
Generate white-label performance audits for your clients with actionable fix recommendations.
Check your vitals daily and get alerted if a new deployment breaks your page experience score.
Performance matters for every type of website
Every millisecond counts. Improve your LCP to reduce bounce rates and increase checkout conversions.
Keep your readers engaged by ensuring your content stays stable and becomes interactive instantly.
Deliver massive value to your clients by proving your optimizations with branded performance audits.
Monitor your web app's responsiveness and interactivity to provide a premium software experience.
See how top engineering teams are passing the Page Experience assessment
This tool identified a layout shift in our footer that three other scanners missed. Our CLS went from 0.4 to 0.05 in one sprint.

The element-level debugging is a lifesaver. Being able to see exactly which image is causing a high LCP makes optimization twice as fast.

Integrating this into our pre-deployment workflow saved us from shipping a JS bundle that would have ruined our INP scores.

Everything you need to know about Google's Page Experience metrics
Join 25,000+ engineers optimizing their Core Web Vitals today.
Get Started Free